


Intro to Power BI: A Toolkit for EHS Leaders
Transform your Data into Insights

The Problem EHS Leaders Face When it Comes to Data
Does this describe your organization?
One system to track EHS incidents
Another to track risk assessments (probably Excel)
A third to use for inspection checklists (Microsoft or Google Forms)
Tracking hours worked manually
Having to export 3-4 Excel spreadsheets and create makeshift charts to copy and paste into a Powerpoint each month
Then doing it all over again every ~30 days
I know this is a real problem, because I experienced it too, and my entire job is IT systems!
But I have good news, it doesn’t have to be this way.
Consolidating your systems may not be a project you can complete overnight, it requires approvals, justifications, vendor involvement, budget conversations, the list goes on.
So what can you do TODAY? You can consolidate your data into a singular platform and showcase your EHS analytics.
How, you may ask?
With Power BI.
What is Power BI?
Power BI is a Microsoft tool that allows you to turn raw data into clear, interactive visualizations and dashboards. For EHS leaders, Power BI can simplify the process of analyzing environmental, health & safety data, automating reports, and presenting insights to your team and leadership.
Why Should EHS Professionals Use Power BI?
Save Time: Automate reporting and eliminate manual spreadsheets.
Identify Trends: Visualize leading and lagging indicators to spot patterns.
Drive Decisions: Present KPIs clearly to help stakeholders act on insights.
Track Progress: Measure metrics like TRIR, DART, and incident rates over time.
I Don’t Have a Budget, Does Power BI Cost?
Great news—getting started with Power BI doesn’t have to cost anything. Microsoft offers a free version of Power BI Desktop, which is more than enough for most EHS professionals to begin analyzing and visualizing their data.
Here’s what you can do with the free version of Power BI Desktop:
Connect to Your Data: Import Excel files, CSVs, and other standard formats.
Build Interactive Dashboards: Create visuals for key metrics.
Analyze Trends: Spot patterns in data and identify opportunities for improvement.
Automate Reports: Update dashboards automatically when you refresh your data.
When Do I Need to Pay?
If you want to share your dashboards online with stakeholders or collaborate as a team, you’ll need to upgrade to Power BI Pro. If your company is a part of the Microsoft ecosystem, you can probably justify a request for a license from the IT team.
But Here’s the Catch: You only need Power BI Pro when sharing dashboards. If you’re just building them for your own use, the free version is perfect!
💡Pro Tip
Start with the free version of Power BI Desktop to build dashboards and reports. Once you see the value, you can justify the cost of Power BI Pro to leadership as an investment in automated reporting and improved decision-making.
Not in the Microsoft Ecosystem? You don’t need to be in order to use Power BI.
It supports a wide range of data formats like Excel, CSV files, Google Sheets, cloud Apps like JIRA and ServiceNow, and databases like mySQL and Oracle.
You can also check out tools like Tableau, Google Looker Studio, Qlik Sense and Domo!
5 Easy Steps to Get Started with Power BI
I’ve included some sample files to help guide you. Feel free to try it out!

Download here --> Sample Files
Step 1: Download Power BI Desktop
Power BI Desktop is free to use and available for Windows.
Click here to download Power BI
Install it on your computer and open the application.
💡Note
If you have a Mac computer, you will not be able to natively use Power BI desktop. My recommendation is to use a paid software called Parallels, this allows you to have both a Windows virtual machine on your desktop and utilize software only available on Windows.
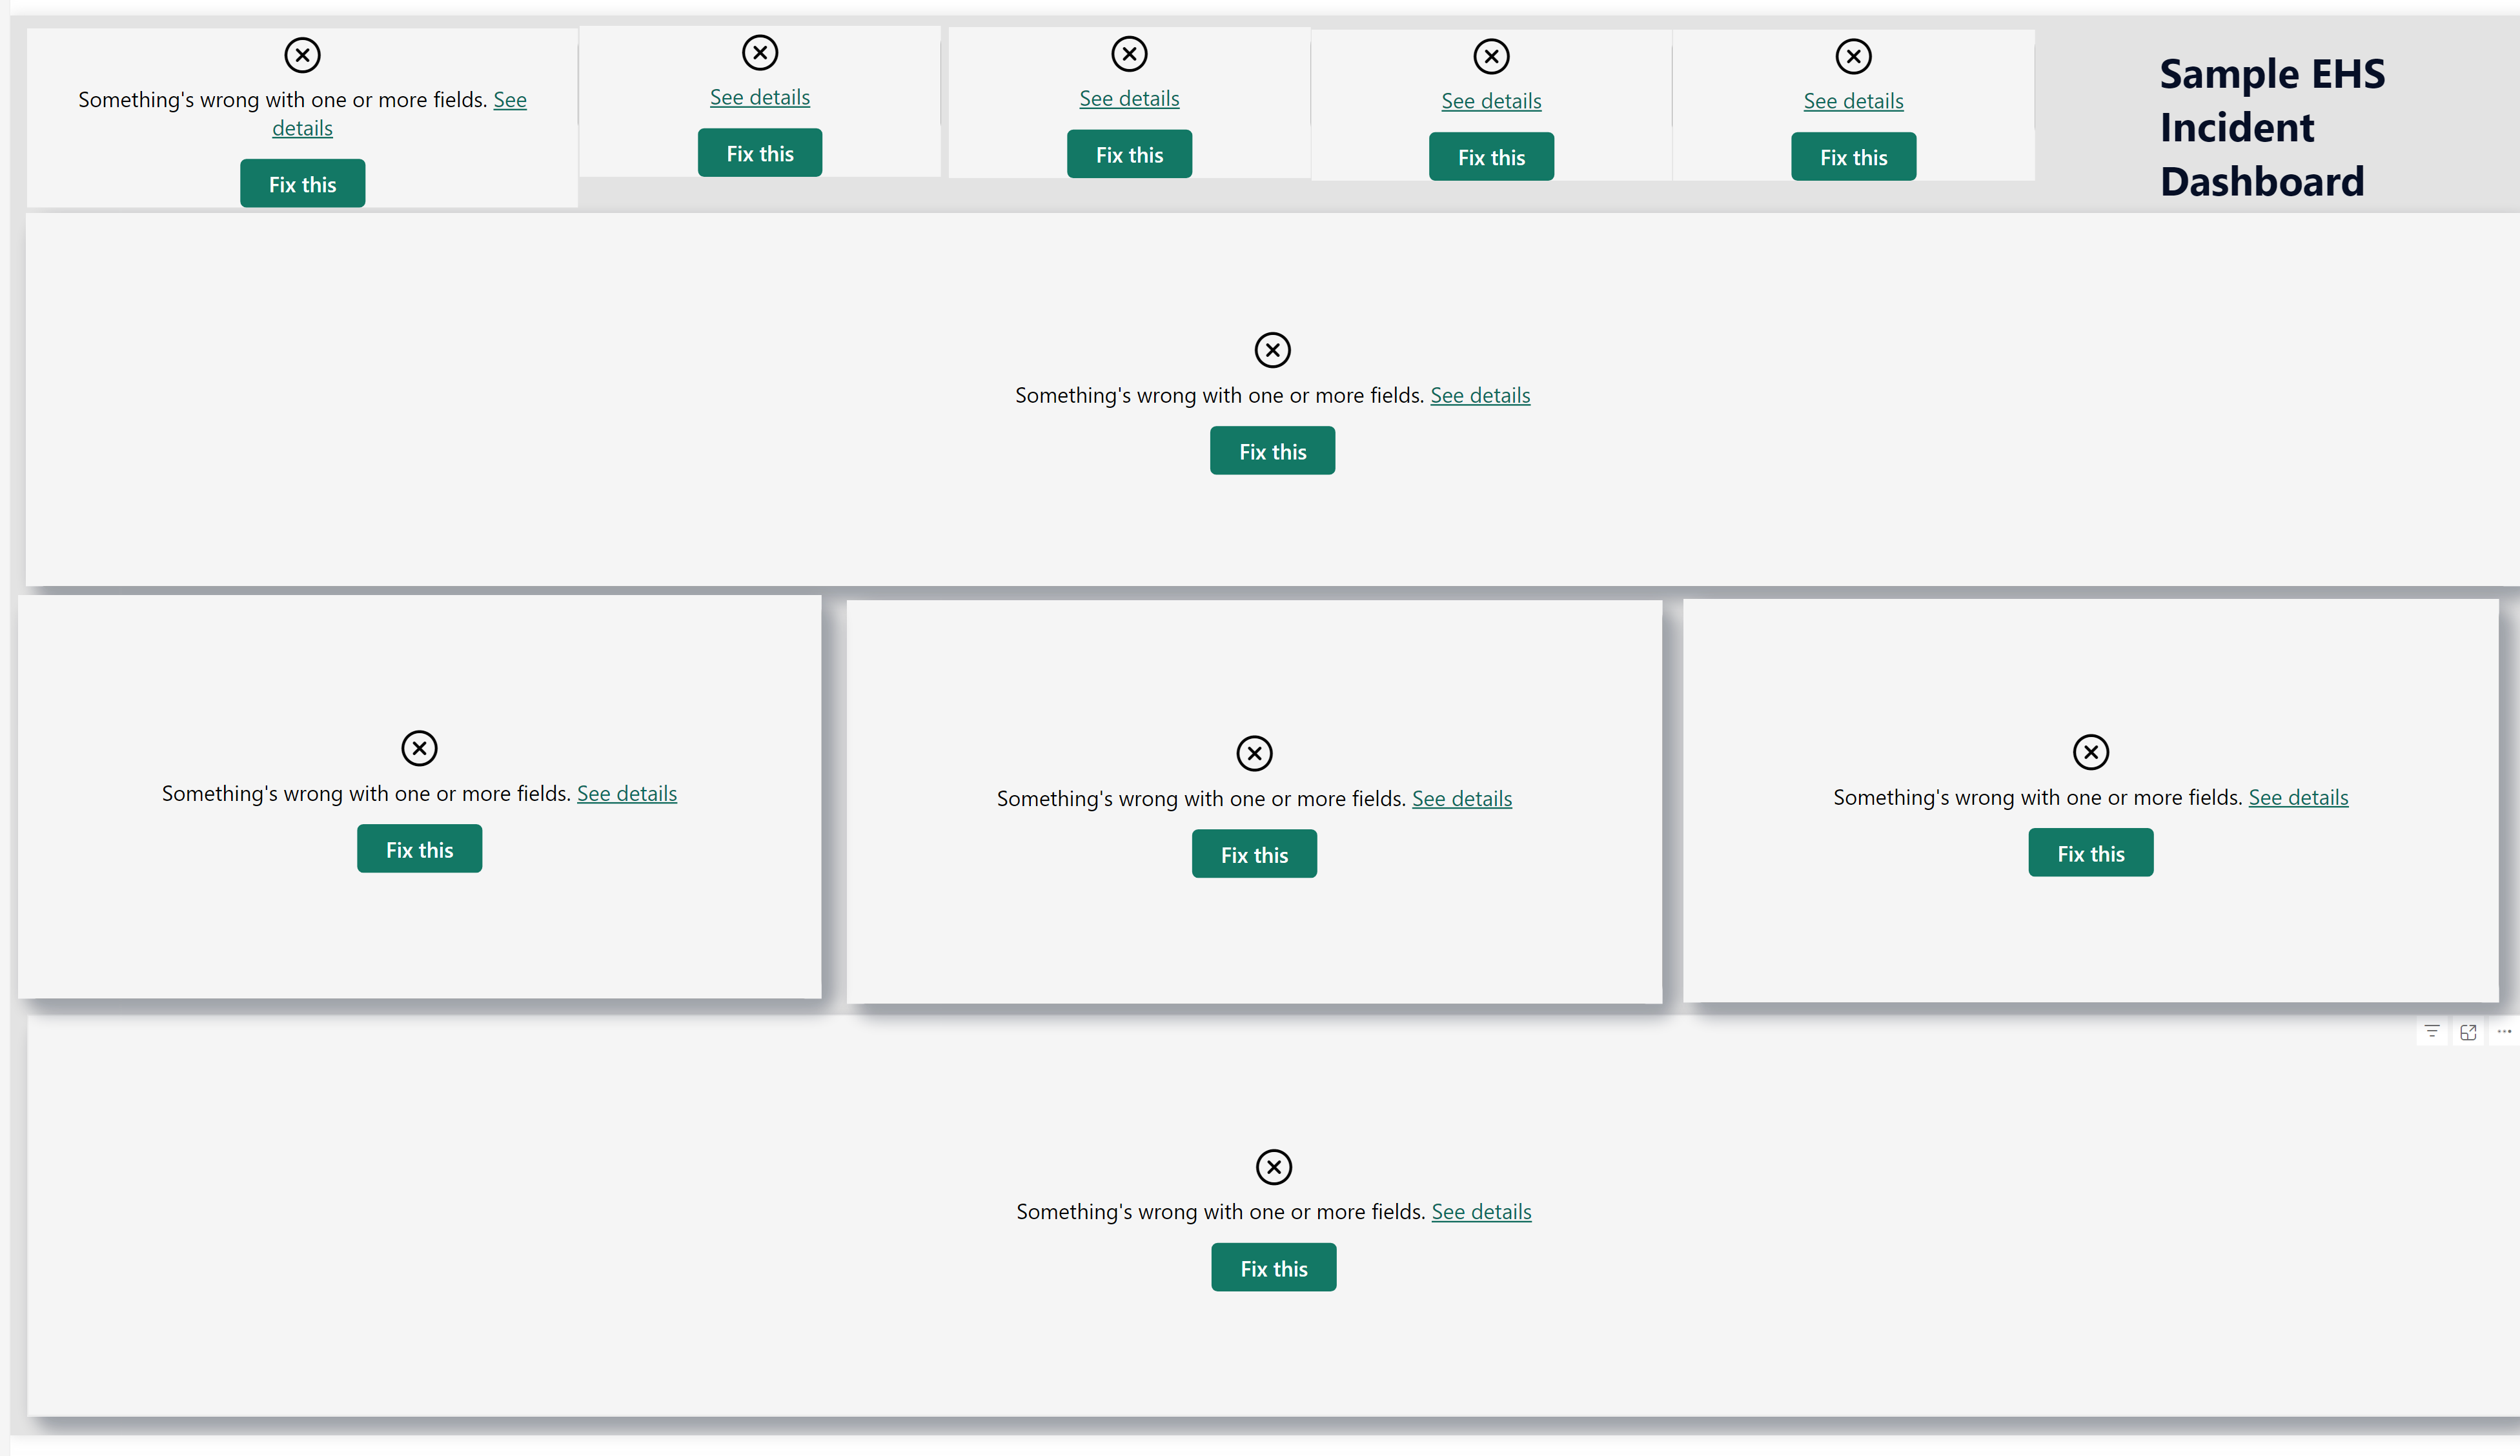
Download all 3 files and open the .pbix in Power BI Desktop.

Don't be alarmed if you see a bunch of "Fix This" icons on the page, this will get resolved.
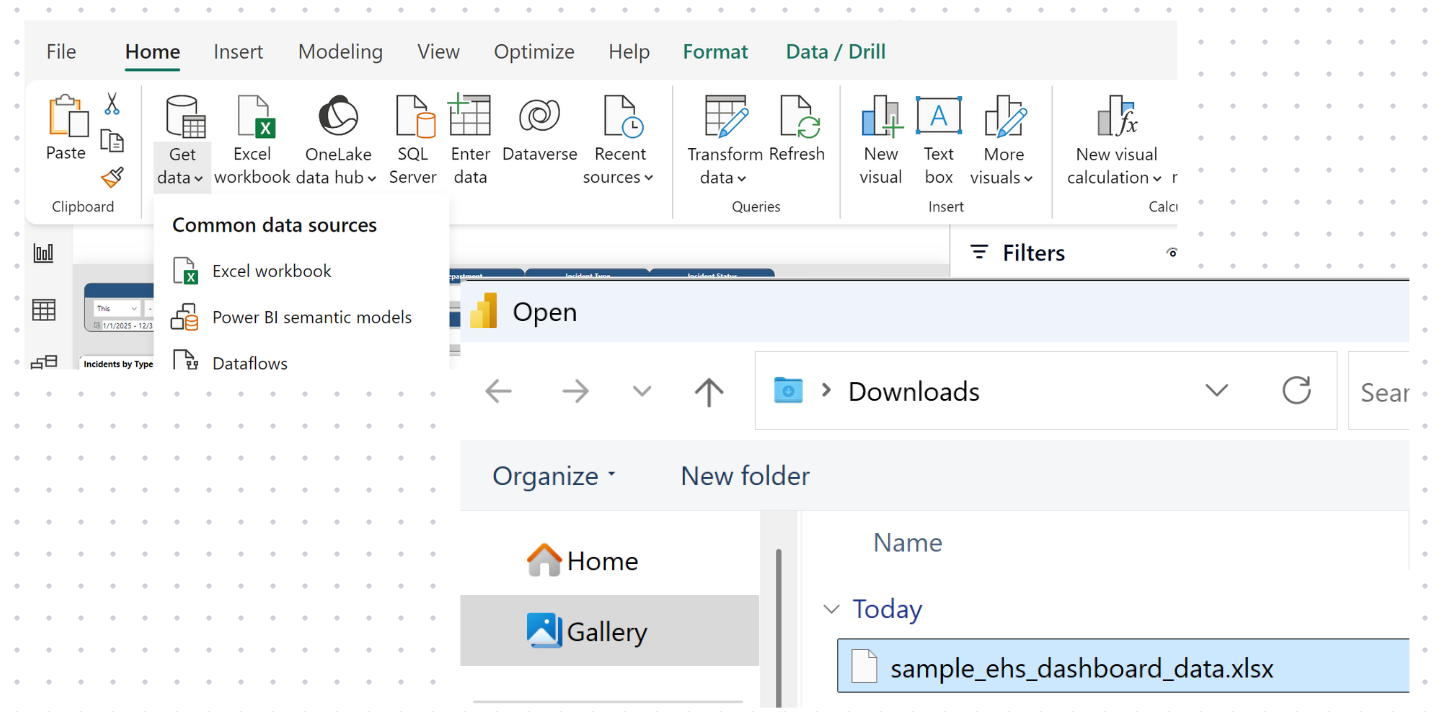
Step 2: Load Your Data
Power BI can connect to a variety of data sources such as Excel files, databases, and cloud-based tools. Some sources, especially cloud-based ones, may require additional configuration to automate data feeding.
For beginners, it’s easiest to start with a simple Excel spreadsheet containing your EHS data. For example, you might have an incident data spreadsheet with columns like Date, Location, Incident Type, and Severity Level.
How-To Steps:
Click on Home > Get Data > Excel.
This will open a file dialog where you can select your file.
Choose your Excel file and click Load to import your data.
Preview the data to ensure it’s correctly formatted before proceeding.
Tip: Make sure your data is organized in a table format within Excel, which Power BI can easily read and load. Each column should have a header describing the data it contains.
Make sure to follow the above steps for both data files:
1. trir_per_month_2023_sample.xlsx
2. sample_ehs_dashboard_data.xlsx

Note: As you load the files, the dashboard should start to self-populate!
Step 3: Create Simple Visualizations
Power BI allows you to create a variety of visualizations that make your data easy to understand.
Visualizations like bar charts, pie charts, and line graphs can help highlight trends and key insights.
How-To Steps:
Select a Visualization Type in Power BI.
You can find visualization options in the ‘Visualizations’ pane on the right. For instance, choose a bar chart, pie chart, or column chart based on what best represents your data.
Drag and Drop Fields into the chart.
Drag the “Incident Type” to the X-Axis and Y-Axis
The Y-Axis will automatically update to “Count of Incident Type”
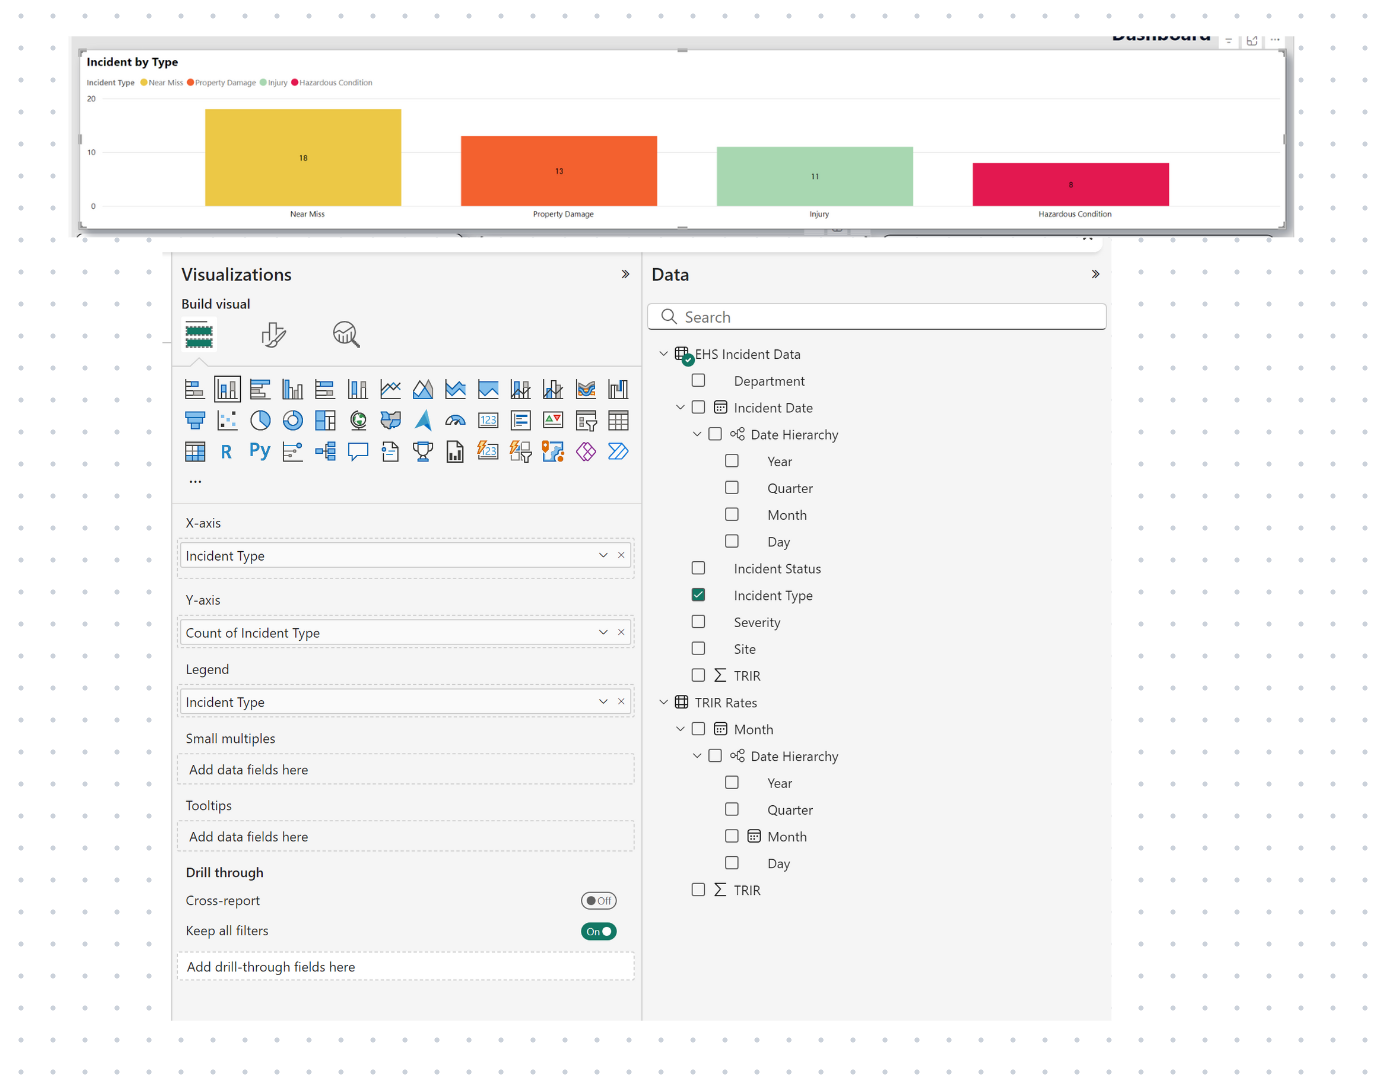
Power BI will automatically create the visualization, displaying the data as a chart. You can customize your chart further by adjusting the formatting options in the ‘Visualizations’ pane.
Tip: Experiment with different chart types to find the one that most effectively communicates your data.
If you are following along, use this time to play around with the pre-built visuals, experiment with different charts, metrics, etc. Step 4: Build Your EHS Dashboard
Power BI allows you to combine multiple visualizations into one interactive dashboard, making it easier to analyze and present your data in a cohesive way.
Sample Dashboard Elements:
Incidents Per Month
Show a monthly breakdown of incidents. You can use a line or column chart to display how incidents trend over time.
Incidents by Type
Compare near misses (leading indicator) vs. actual incidents (lagging indicator). A bar or stacked column chart works well for this comparison.
Incidents by Severity Category
Display the incidents by Severity. And then furthermore by the Incident Type so you know where to focus your efforts.
TRIR
Include key safety metrics like Total Recordable Incident Rate as a line chart so trends can be identified
How-To Steps:
Add Visuals to Your Report
For each dashboard element, select the appropriate visualization (e.g., line chart, bar chart, card) and drag the relevant fields into the chart.
Arrange Your Visuals
Organize the visuals on your report page. Use a grid layout to align the elements neatly, making the dashboard easy to read.
Make Your Dashboard Interactive
Add filters and slicers to allow users to interact with the data. For example, use a date slicer to allow users to select a specific time range, or a location slicer to filter by specific regions.
Step 5 (Optional): Publish and Share
Publish it to Power BI Service. More info on how-to complete that step is here.
Share it with stakeholders using a simple link.
Sample EHS Dashboard in Power BI
Here’s what a beginner-friendly EHS dashboard might look like:
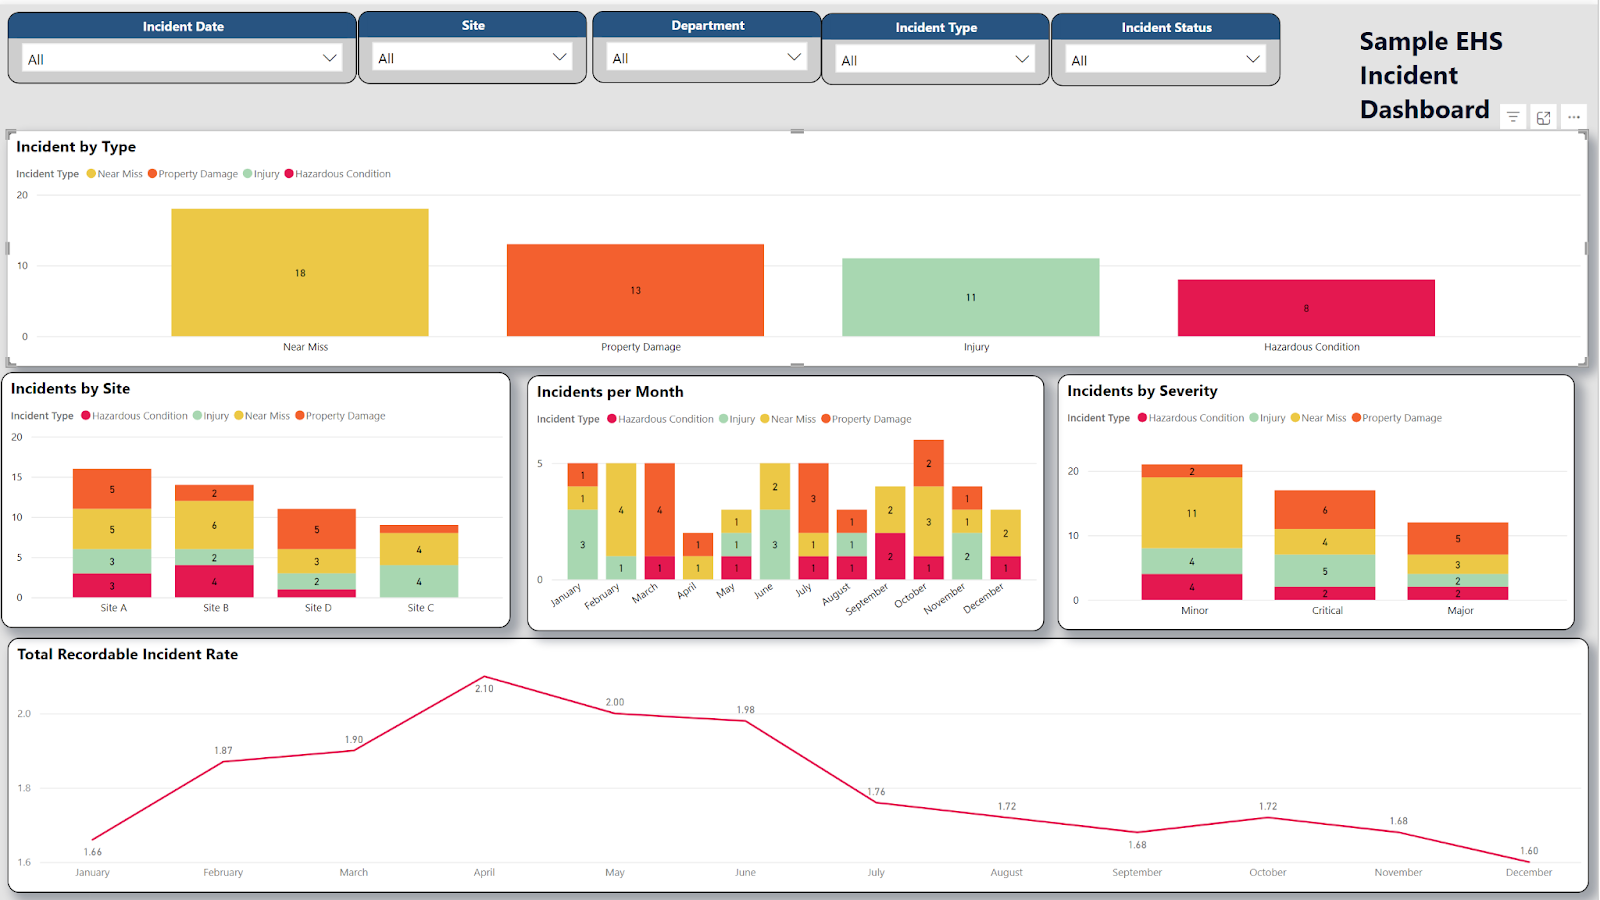
Top Metrics Displayed:
Incident Trends: Compare incidents month-over-month.
Incident Distribution: Breakdown by site and severity level.
TRIR: Automated KPI tracking
Next Steps: Take Control of Your EHS Data
By using Power BI, you can simplify reporting, identify trends, and clearly communicate your EHS performance to leadership.
Want to learn Power BI more in-depth? I highly recommend Arno Wakfer’s “The 8-Week Power BI Guided Learning Plan”, to really upskill your Power BI experience, you can check it out here.
Did you find this article useful? Let me know in the comments or any questions you may have, I’m here to help!
Want more free tools and tips for improving EHS systems, software and data analytics? Subscribe to my newsletter here on Substack and join the EHS Tech Connect community for more actionable insights and strategies.
Need help setting up Power BI or an EHS dashboard built for you? Let’s chat.